
Water Quality Contamination

Sulfates at the Buckhorn mine
Sulfates at the Buckhorn mine (NLF-3 wells)

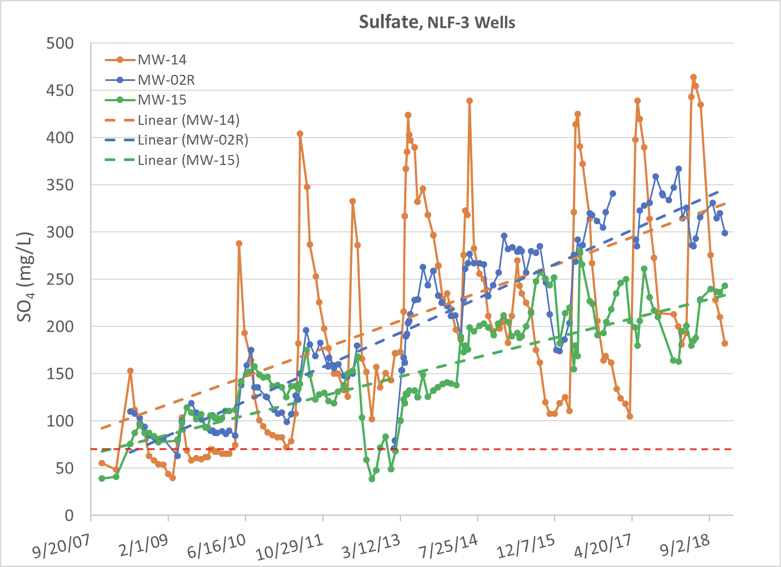
The red dashed line in the above graph shows the allowable (2014 permit) level of sulfate. The other dashed lines show the general trend of sulfate levels in various monitoring locations.

These monitoring wells are located in a fault downgradient from the mine, just outside the capture zone, which is supposed to capture all mine contaminants. Sulfate concentrations in all these monitoring wells (MW) are still increasing. Many values in MW-14 and MW-2R even exceeded the State groundwater standard (250 mg/L — a much higher level than the 69.5 mg/L allowed by the permit). Although MW-14, which is closest to Gold Bowl Creek, had the highest peak concentrations, the recent overall trend in that well could be decreasing slightly.

Continue reading

Water Quality not improving at the Buckhorn Mine

Mine Seepage Exceeds Permit Limits; Violations Mount

The 2018 Annual Coordination Meeting at the Buckhorn Mine included a presentation from Dr. Ann Maest, OHA’s consulting aqueous geochemist. Dr. Maest has worked on Buckhorn issues for 25 years and is an expert on the environmental impacts of mining, working on projects internationally. In contrast to the water quality presentation given by Crown Resources, Dr. Maest took a critical look at the previous year’s data. In her presentation, Dr. Maest concluded that, despite ongoing mitigation measures at the mine, water quality was not improving in key locations at the site. The presentation focused on the water quality impacts of two contaminants of concern: sulfate and nitrate.

OHA’s technical expert, Dr. Ann Maest
OHA’s technical expert, Dr. Ann Maest, provides an analysis of the water quality monitoring data.

Continue reading

Go Back